
The Hexoskin OneView dashboard offers four methods to monitor the signal quality of the shirt's sensors. These methods include:
- Checking the signal quality columns in the "Subjects" module of the OneView dashboard
- Refering to the signal quality chart available on a subject's profile
- Looking at the signal quality percentages for a whole record from the record page
- Checking the signal quality flags displayed on the record's chart
- Examining the data quality channel files after extracting the data in the "Binary" format
Below are the details about each of the methods for monitoring signal quality:
1. Checking the signal quality columns in the "Subjects" module of the OneView dashboard:
In the "Subjects" module, you can access various details about your participants. The last two columns in this module display the signal quality for each subject. These columns are "HR Quality" (heart rate) and "BR Quality" (breathing rate).
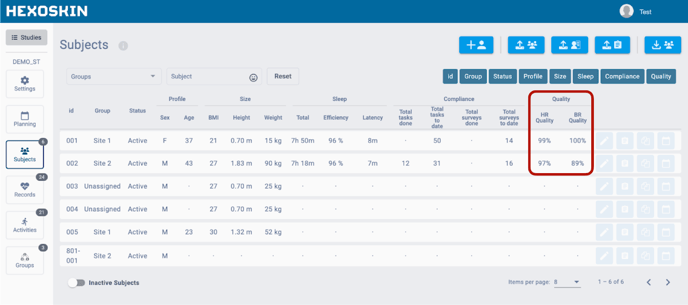
Each column displays a percentage that represents the amount of good-quality signal recorded during the entire recording duration. For example, if your "Subject 001" has done 5 records and you see 98 in his "HR Quality" column, it means that 98% of the entire recording time this participant has done is of good quality.
2. Refering to the signal quality chart available on a subject's profile:
Within a subject's profile, you have the ability to view a chart that displays the "Signal Quality" of the latest 1 to 12 records for heart rate signal only. The signal quality chart provides a quick and comprehensive overview of the signal quality for all records shown with regard to time.
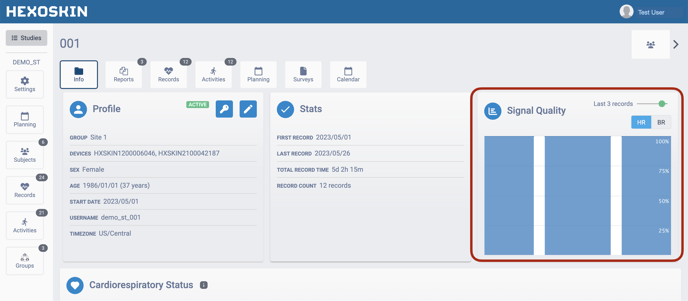
You can choose to display the signal quality chart for the Heart Rate and the Breathing Rate.
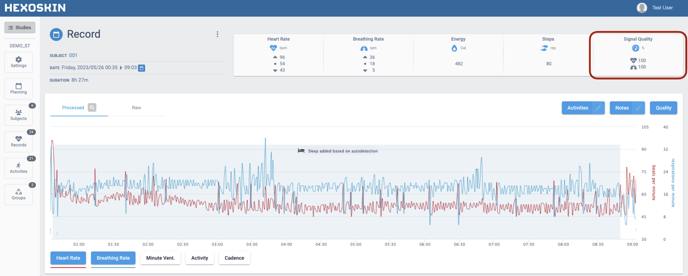
3. Looking at the signal quality percentages for a whole record from the record page:
Upon accessing a record's page, you will notice a Signal Quality cell located at the top right corner. This cell provides you with the Signal Quality percentage for both the Heart Rate and Breathing Rate metrics. The percentage displayed for each metric represents the portion of the record that is of good quality.
4. Checking the signal quality flags displayed on the record's chart:
When you look at a record’s chart, you can see quality signal flags beneath the chart. The blue line is associated with the breathing rate signal whereas the red line indicates the heart rate signal quality.
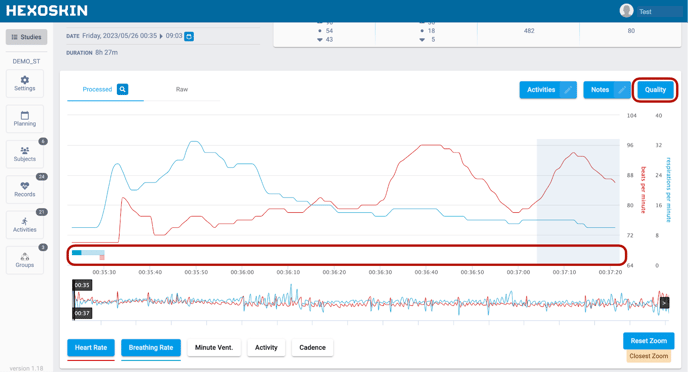
Note: The darker the bar's color, the lower the signal quality.
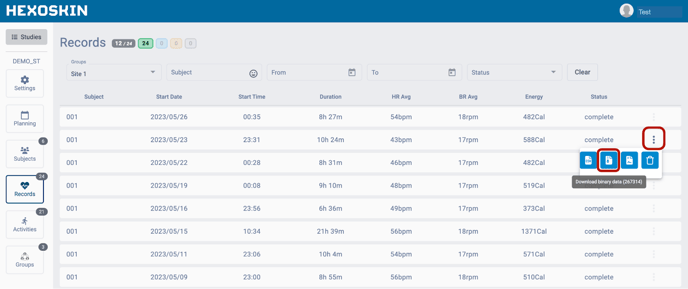
5. Examining the data quality channel files after extracting the data in the "Binary" format:
To access signal quality files, you can download the Binary format files for the record you are interested in.
Once you have downloaded the Binary format files of a record, you will have a zip file containing many csv and wav files. Among these files, you will find three signal quality files:
- breathing_rate_quality.wav
- heart_rate_quality.wav
- RR_interval_quality.csv
To convert the wav files into CSV files, you can follow the steps presented in this article: Software to open and work with wav files.
To understand what the values mean in those signal quality files, please refer to this link: https://api.hexoskin.com/docs/resource/datatype/