
In the Health Status tab on the Hexoskin Dashboard, you will find all the data that can be used as personal health indicators.
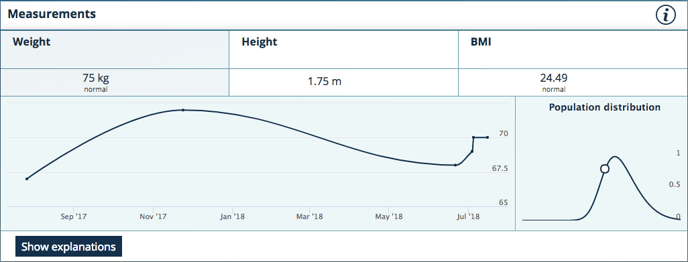
All the graphs from the sections Cardiorespiratory Status, Measurements and Sleep will show you all the historical data for the selected metric. You then can track the evolution and progression of the metric of your choosing (your weight, for example) and have an overview of your health condition.
Please note that it takes at least 2 data entries for each metric for a graph to be generated.
With 2 or more data entries, your graph will look like this:
To create data entry in the Cardiorespiratory Status section, you need to perform and complete the Fitness Tests with your Hexoskin App for the data to be displayed. You can also create a manual entry using the .
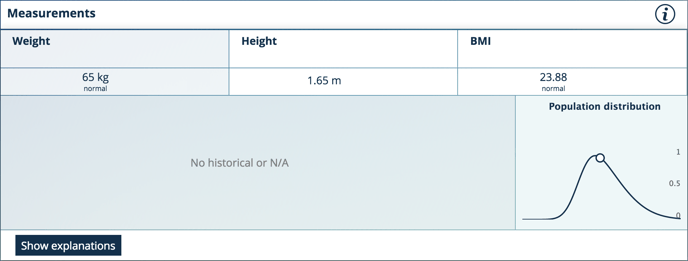
To create data entry in the Measurements section, you can input your height and weight manually using the and your BMI will be calculated automatically. In the same way, you can input your thoracic and abdominal circumference and a shirt size will be suggested to you.
To create data entry in the Sleep section, you need to perform sleep activities for the sleep data to be displayed. No manual entry is possible in this section.