
On the Hexoskin Dashboard, there is a tab named "Timeline" that displays the history of your Records and Activities.
In the section Filter, you can use ![]() to narrow down your search for Records or Activities to a specific or custom time range. Tick the box « Show Activities recorded with Hexoskin App » to display only the Activities that were launched via the Hexoskin App.
to narrow down your search for Records or Activities to a specific or custom time range. Tick the box « Show Activities recorded with Hexoskin App » to display only the Activities that were launched via the Hexoskin App.

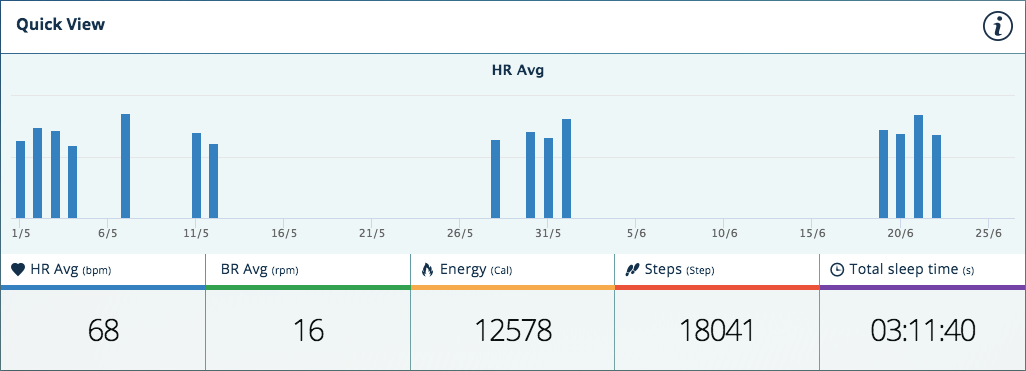
In the section Quick View, the chart shows the heart rate average (metric by default) for the time range set in the filter section (Last Record by default). Click on the other metrics to have them displayed in the chart. Change the time range in the Filter section.
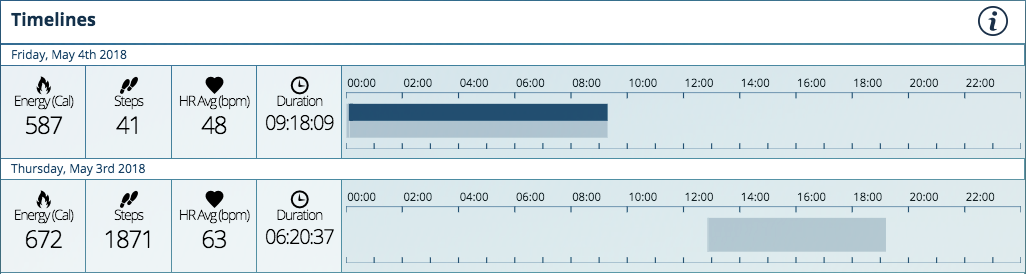
In the section Timelines, you will find the summary of the metrics for your Activities or Records and a timeline that displays when the Records/Activities took place (i.e. boxes on the timeline).
A Record is represented by ![]() , while an Activity is represented by
, while an Activity is represented by ![]() . Since an activity corresponds to a range of data extracted directly from a recording, the activity boxes will be displayed as superimposed boxes on the recording boxes (
. Since an activity corresponds to a range of data extracted directly from a recording, the activity boxes will be displayed as superimposed boxes on the recording boxes (![]() ). To directly access the Record of your choice, click on
). To directly access the Record of your choice, click on ![]() . To directly access an Activity, click on
. To directly access an Activity, click on ![]() .
.
Keywords: data, time line, historical, archive, past, period of time